Charting is a way of tracking different types of information related to your personal finances to help you analyze your performance and determine how close you're to keeping within your goals. Charting can be done to analyze a single account, a category, a type of account, including Profit and Loss report. You can think of it as an extension of the statistics because it also serves to identify areas where improvements could be made.
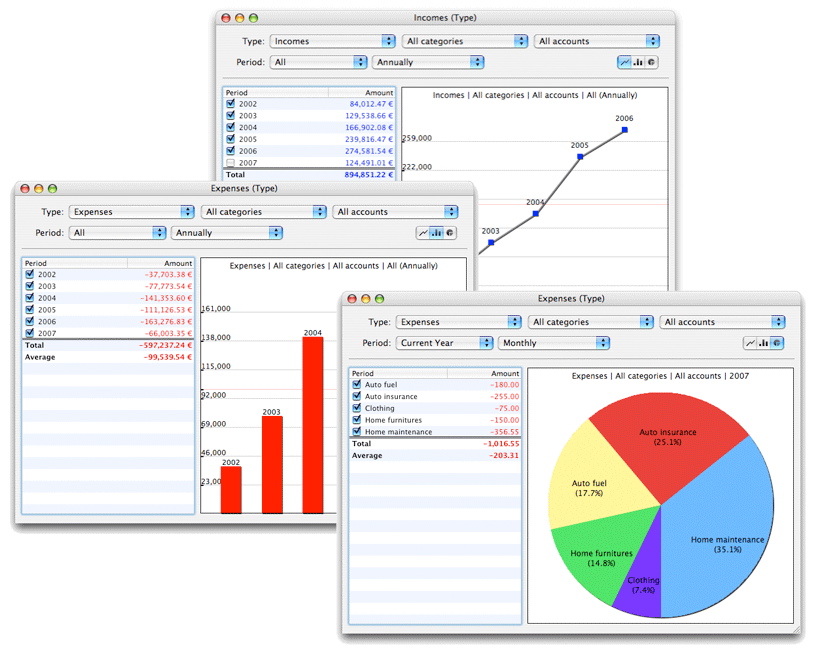
iCash offers 3 types of charts, Line, Bars and Pie. Line and bar charts are intended to display the evolution of an account or a group of accounts over the time whilst the pie chart simply shows ratios allowing you to visually compare accounts or categories of the same type. For example it allows you to know the proportion of a given expenditure compared to others.
The fastest way to create a chart is selecting an entry from the Overview or the Account panel and press the Chart button. You can use a single account, a category or a whole account type. You can also start with a generic Chart window or edit parameters:
Period, available options are: All, Current Year, Last Year.
Frequency, available options are: Monthly, Quarterly, Semiannually, Annually.
Types, available options are: All types, Banks, Incomes, Expenses, Liabilities, Portfolio, Assets.
Category, available options are: All categories or any given single account.
Account, available options are: All accounts or any given single account.
Charting windows is made of two panes. The left panel displays the values for each period (or account) allowing you to activate or deactivate corresponding nodes in the chart panel on the right. You can print your chart using the File | Print menu or copy it to the clipboard using standard Edit | Copy menu.
|


